SUNY Geneseo Department of Mathematics
Math 230 01
Fall 2015
Prof. Doug Baldwin
Complete by Wednesday, October 21
Grade by Friday, October 23
This lesson expands your understanding of plotting and matrices in Matlab, and develops your ability to design and write programs independently.
Matlab can plot functions in 3 dimensions as well as in 2—in other words, it can plot functions of the form z = f(x,y), parametric lines in which three coordinates—x, y, and z—are functions of parameter t, etc.
Two crucial Matlab functions for 3-dimensional plotting are the surf and
mesh functions. The surf function plots a 3-dimensional
surface as a solid surface with grid lines drawn across it to help show its shape.
For example…
The simplest way to use this function is
surf( x, y, z )
where x is a vector of x values for grid lines
(i.e., there will be a grid line perpendicular to the x axis for each value
listed in x), y is a vector of
y values for grid lines, and z is a matrix containing
the z values at each intersection of grid lines. Note that the columns of
the z matrix correspond to x values, and the rows
to y. This form of surf will color the surface according to
its z value.
The mesh function is analogous to surf, but only draws grid
lines, not the solid surface.
See Matlab’s built-in documentation on surf and mesh
for more information about these functions.
You may also find the meshgrid function helpful. This function builds
a pair of matrices from a pair of vectors, x and y. Both matrices
have as many columns as there are elements in x, and as many rows as there
are elements in y. In the first matrix, every row is a copy of x,
and in the second matrix every column is a copy of y. While this probably
seems to be a very strange thing to want to compute, the two matrices turn out
to be exactly what you need if you want to write an expression that uses element-by-element
arithmetic on the two matrices to evaluate some function for every possible pairing
of an element from x with an element from y. See the Matlab documentation
on meshgrid for more information.
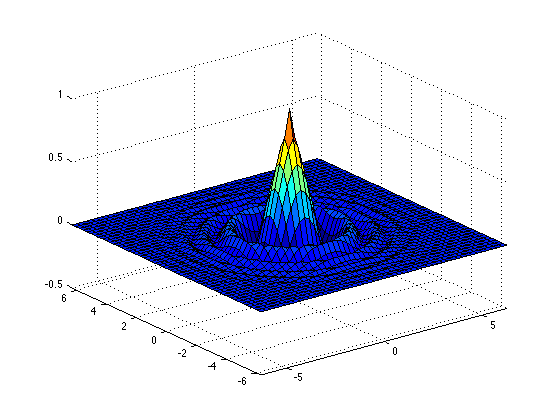
Write a Matlab script that plots the function z = e-r cos( r2 ) where r =√(x2 + y2). Your script should create all the variables needed to produce the graph, and should do all the calculations needed to give those variables their values. You may plot the function over any range of x and y you like, although I found that -2π ≤ x ≤ 2π and -2π ≤ y ≤ 2π produces a nice-looking graph.
The graph in the “Background” section above shows this function, over the interval -2π ≤ x ≤ 2π and -2π ≤ y ≤ 2π.
I will grade this exercise in a face-to-face meeting with you. During this meeting I will look at your solution, ask you any questions I have about it, answer questions you have, etc. Please bring a written solution to the exercise to your meeting, as that will speed the process along.
Sign up for a meeting via Google calendar. If you worked in a group on this exercise, the whole group should schedule a single meeting with me. Please make the meeting 15 minutes long, and schedule it to finish before the end of the “Grade By” date above.