= 1.10. It starts at 100 individuals at t=0. What is the population at t=3?
a. 90
b. 100
c. 110
d. 121
e. 133
2. Using the equation Nt = No ert, with r = 0.1, No = 100 and t = 5, the population will be
a. 100
b. 110
c. 150
d. 165
e. 180
3. Which of the following is not a characteristic of invasion species? [student submission]
a. most are caused by humans
b. most fail
c. most have minor consequences
d. take a vacant niche in the community they are invading
e. all of the following are characteristics of an invasion species
4. Doubling time in exponential growth (Nt = No ert) is equal to
a. t
b. rt
c. ln(rt)
d. 2ert
e. ln(2)/r
5. A regulated population, that strictly follows the logistic equation,
a. increases slowly at first, then quickly, then slowly.
b. decreases to carrying capacity like a decelerating car.
c. does not change.
d. all of these can happen.
e. none of these can happen.
6. Life history is the study of
a. the adaptations that influence age-specific survival
b. the traits involved in aging
c. the changes of trees during growth
d. the study of the history of life on earth
e. all of these are part of the study of life history.
Given the following Leslie matrix and age-class vector, answer questions 7-9.
L = 0.1 1.0 2.0 No = 10
0.8 0 0 10
0 .5 0 10
7. The current population is
a. 1
b. 10
c. 3
d. 30
e 300
8. There will be how many babies next year
a. 1
b. 10
c. 25
d. 31
e. 35
9. Next year’s population is
a. 35
b. 40
c. 44
d. 50
e. 60
10. The work of Andrewartha and Birch on thrips suggested that
a. populations appear to be regulated by predators
b. populations appear to be regulated by abiotic factors
c. both predators and abiotic factors interact to influence populations
d. all of the above were found important
e. none of the above
11. Dragonfly mating, according to the reading in the Eastern Forests fieldguide,
a. involves male contact-guarding of females, resulting in males attaching themselves to the
female for long periods of time.
b. does not take place – they are all females and reproduce parthenogenically.
c. takes place at extremely high altitudes to avoid predation.
d. results in the female eating the male.
e. none of the above.
True or False. Answer all. (2 pts each, 10 pts total)
T F Populations are regulated by one of the following: intrinsic biotic factors, extrinsic biotic factors, extrinsic abiotic factors.
T F Extinctions are a natural occurrence that we can only hope doesn’t happen to the species we care about.
T F Most invasions by non-native species are unavoidable.
T F Plants that exhibit facultative apomixis are good at colonizing new areas because they have sex with themselves which generates variable offspring through mutation and recombination.
T F Introduced species usually fail to become invasive and when the do they usually have little effect.
Short answers. Use only the space provided. Your answer should fit. I am not responsible if illegible. ANSWER 15 of 16. (3 pts each; 45 points total)
1. Why do male lions sometimes kill cubs?
2. Define "Population Ecology."
3. Define Density.
4. Discuss the dispersion pattern of the following map of individual trees:
5. You capture 25 individual mice. You mark and release them. One week later you set your traps and find that 8 of the 24 are marked. What is your estimate of the mouse population.
6. I showed the following figure from your book and mentioned there was an error. It states that the slope 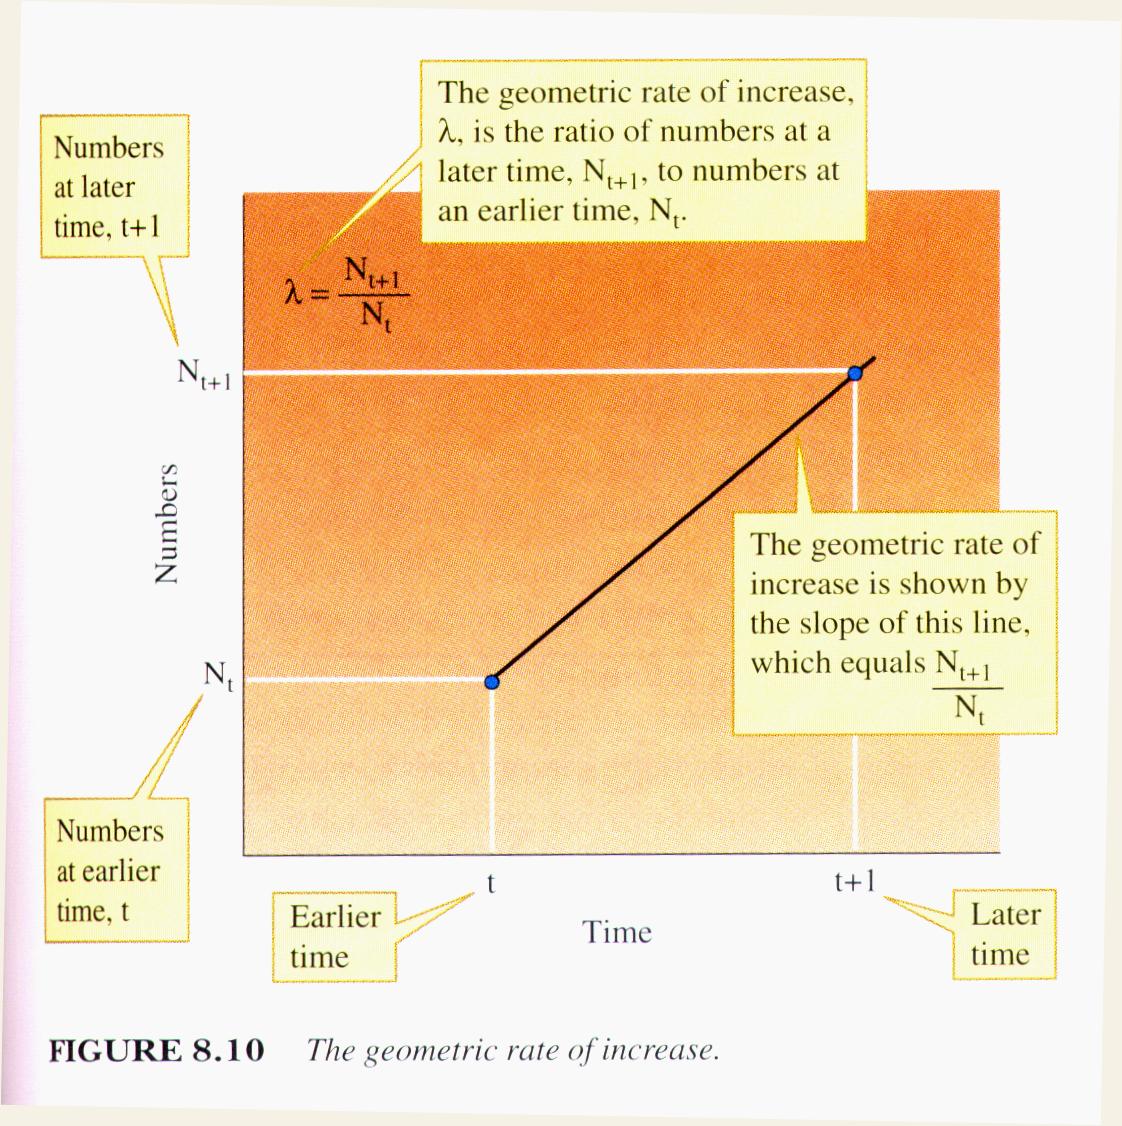 of the line = the growth rate
. If I am right fix the problem. Otherwise explain why I am wrong.
 7. Given the following diagram, construct a complete Leslie matrix using the provided symbols (there are no values or numbers to use).
8. Briefly discuss the value of the Leslie matrix. What does it yield, how is it unreasonable, and why should we investigate this given these limitations?
9. What is the significance of extinction to ecology?
10. Invasive species are species that have not evolved in the area they are invading. How can they be so successful?
11. Briefly describe one technique discussed in lecture to model the spread of invasive species. Provide a diagram or graph.
12. Why do Thomson’s gazelles stot? Provide a line of evidence that rejects an alternative hypothesis.
13. List three reasons why dispersal is important.
14. What is the relationship between ungulate body mass and social structure (no graph necessary)?
15. What is meant by "bird irruptions"?
16. Why to birds form flocks?
In the spaces provided create graphs of the relationships and explain (3 pts each, 30 points). Answer all.
1. The relationship between animal size and animal density.
2. Diffusion of a population in one-dimensional space.
3. Draw a rough scaling diagram of a bird species dispersion pattern from the continent to its breeding
territory (this should look like a map).
4. Draw a configuration of resources that you think should lead to territoriality. Briefly explain why territoriality would likely arise (this should look like a map).
5. Graph N vs. time for geometric and exponential growth (use the same graph). Assume r=0.10 and
= 1.10. I will look for the differences between your graphed relationships.
6. Draw a graph where bo is a function of N but do is not for a regulated population.
7. Based on your curves for bo and do in question 6 draw N vs time.
8. Draw a graph of the frequency of humans in the following four age classes (0-12, 12-20, 20-45, and >45 years). There is some flexibility in how you graph this relationship. Briefly discuss whether you think this population will increase, decrease, or remain stable. Your conclusion must be consistent with your graph.
9. On the provided axes draw the Allee effect. Label axes (values are not required). Analyze your graph (do not provide a narrative).
10. Based on your graph above, graph N versus time. Explore various values of N.