Scores for Exam 1
As a whole class, performance on this exam was quite poor. Although there were three perfect scores on WebAssign, and one perfect exam overall, there were way too many scores on the low end as well.
I searched for reasons that this might have happened, to little avail. The exam was not longer than usual. The questions were not any more difficult than usual. Maybe the students who had Fletcher last semester were unused to the Exam format, but I have a hard time imagining that having a large impact.
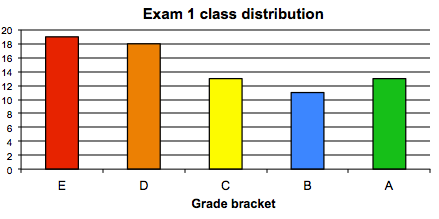
In the end, I did apply a modest "curve." On your paper, you will see the raw score (so you can check my addition), and the effective score (circled). With this adjustment, the overall class average was 70.9%, and the median was 69.9%. Class grade distribution is below.
About 10% of the class benefitted from the No-Risk Quiz. The effect of the No-Risk Quiz will be applied in your grade as visible in myCourses, but is not reflected in the histogram below.
Class grade distribution for the Exam is to the right. The bars of the histogram correspond to the letter grades (A, B, C, D, and E). To see how to interpret numbers, go to this link.
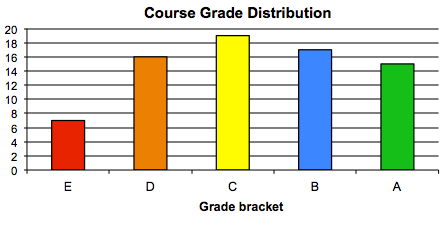
Keep in mind that, in this class, homework scores are typically higher than exam scores. The second histogram shows the class "extrapolated grades": combined performance on exams and homeworks. In particular, these extrapolated grades include the homeworks 0 through 4.
Your personal combined grade can be found on the Course Home tab in myCourses. |
  |