Scores for Exam 2
I searched for as many partial credit points as I could, and the class gained quite a bit from the extended time exam
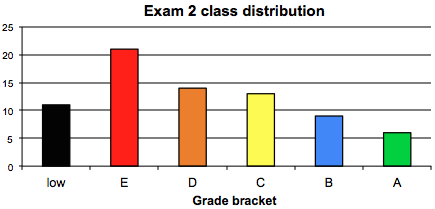
session. In the end, though, it just wasn't enough. The distribution, as you can see, is still pretty poor.
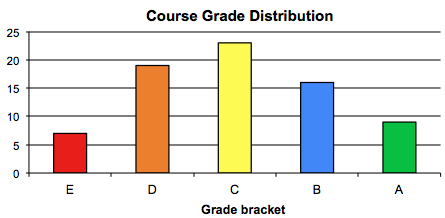
But I think it is time to move dorward, looking into the future instead of the past. As you can see from the current course grade distribution (which includes homeworks up through number 9) Most people are well withing the passing range. And we have more than half of the "Exam" portion of the grade to complete. So lets pull up those grades!
I did apply a modest "curve." On your paper, you will see the raw score (so you can check my addition), and the effective score (circled). With this adjustment, the overall class average was 65.2% (standard deviation of 15.5%), and the median was 62.3%. Class grade distribution is below.
About 17% and 28% of the class benefitted from the No-Risk Quizes, respectively. The effect of the No-Risk Quiz will be applied in your grade as visible in myCourses, but is not reflected in the histogram below.
|
Class grade distribution for the Exam is to the right. The bars of the histogram correspond to the letter grades (A, B, C, D, and E). To see how to interpret numbers, go to this link.
Keep in mind that, in this class, homework scores are typically higher than exam scores. The second histogram shows the class "extrapolated grades": combined performance on exams and homeworks. In particular, these extrapolated grades include the homeworks 0 through 4.
Your personal combined grade can be found on the Course Home tab in myCourses. |
|