Current Density Illustration

(NOTE: This page is intended to be viewed in a wide enough window so that two animations are side-by-side; otherwise the descriptions might not quite make sense.)

This page aims to look at how the different variables in the current density definition relate.
   and  
where J is current density, q is the charge of one charge carrier, n is the charge carrier volume density, v is the velocity of the carriers, and i is the total current passing through an area described by A.

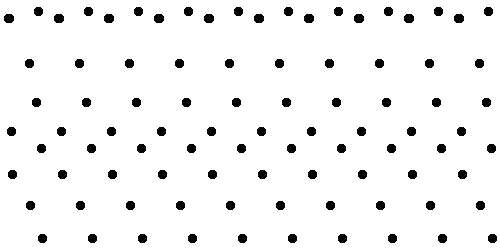
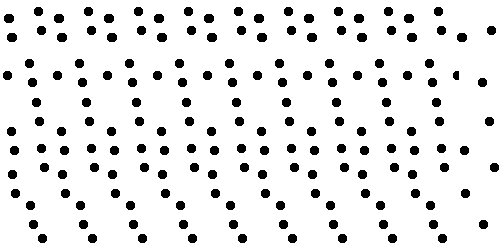
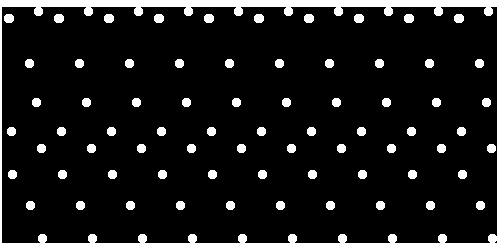
The following animations show charge carriers, with varying densities n, flowing with various velocities v.

In this box...

  • Pairs of animations that are next to each other DO NOT have the same current or current density.
  • But pairs of animations that are above/below each other DO have the same current and current density.

The following pair of animations differ only in that the carrier density n is larger on the right by a factor of two. The equations tell us that the resulting current on the right should be twice as big.  If you focus on the space between the animations, you can perhaps convince yourself that more dots are leaving that junction than are coming in.

The following pair of animations differ only in that the velocity v is larger on the right by a factor of two. Again, the equations tell us that the resulting current on the right should be twice as big, and you can see this most easily if you focus on the space between them.

In this box, horizontal pairs of animations DO have the same current.

If the same charge is flowing down the wire, then the size of the wire makes no difference.
=

Another issue that comes up is negative charge on each charge carrier.  The following pair of animations might help you convince yourself that positive charges flowing to the right is the same as negative charges flowing to the left.  BOTH produce a current density vector that points towards the right.

= negative charges flowing