Homework 12 - Basic Plotting
Due Date: December 19, 2023
Problems
- In a figure with one plot, graph the functions \(\sin(x)\), \(\cos(x)\), and \(\arctan(x)\) on the interval \([-2\pi,2\pi]\). Use enough data points so that the graphs look smooth. Label the horizontal and vertical axis, use a legend, and clearly distinguish the curves of each function with differing line styles and colors.
In a figure containing a \(2\times 2\) grid of subplots, plot the functions \(\sin(x)\), \(\sin(2x)\), \(2\sin(x)\), and \(2\sin(2x)\) so that each subplot contains the graph of only one function.
- Give a title to each subplot and make sure there is ample horizontal and vertical padding between subplots.
- The horizontal limits of each subplot should be \([0,2\pi]\) and the vertical limits should be \([-2.5,2.5]\).
- Google the method
suptitleand use it to give the figure an appropriate title. - Use the following color and line styles:
- \(\sin(x)\): green solid line
- \(\sin(2x)\): red dashed line
- \(2\sin(x)\): cyan circle markers
- \(2\sin(2x)\): magenta dash-dot line
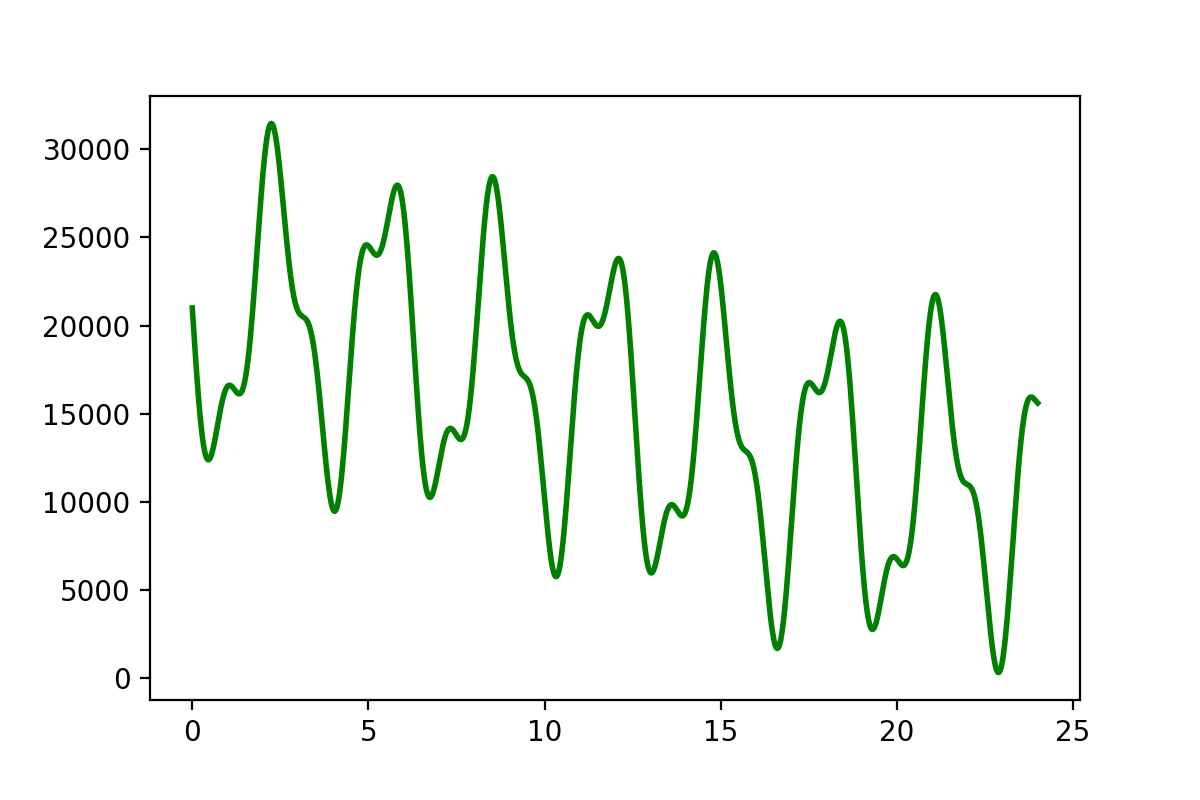
An experiment was performed over a period of 24 hours and experimental data was collected by six different teams. The experiment was concerned with measuring the intensity of a radio signal, denoted by \(F(t)\), at times \(t\) in the interval \([0,24]\). Each team measured the intensity \(F(t)\) at different times and each team generated a file containing their measurements (team_1.txt, team_2.txt, team_3.txt, team_4.txt, team_5.txt, team_6.txt). Each line of each file is in the format \(t, y\) where \(t\) is the time and \(y=F(t)\) is the measured intensity. Due to a malfunction in the experimental apparatus, the measurements in each file are out of order. Your job is to merge all the data into two NumPy arrays and plot the data. To help you with this task, do the following:
- Use a for loop to read and save the data in two Python lists; make sure to convert all data to floats. One list should contain the time data and the other the intensity data. Do not copy-paste the data into Python (no partial credit will be given if copy-paste is done).
- Create NumPy arrays from the two Python lists from part (a).
- Find the sequence of indices that sorts the NumPy array that holds the time data and use the indices to sort both the time and measurement arrays.
- Plot the data, give the plot a title, and label both axis appropriately. Your plot should have the following form: