Misc
Exam 2 is tomorrow (November 2).
It will cover material not tested on the first exam, for example the chain rule, implicit differentiation, related rates, linear approximations, extrema, shapes of curves, limits at infinity and asymptotes, etc.
The rules and format will otherwise be similar to the first exam, especially “open-references, closed-person.”
Questions?
Area Under a Curve
Recall from the “Preview of Calculus” class that the area under a curve can be estimated by dividing the area into approximating rectangles and adding up their area:
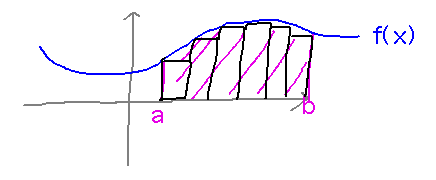
Attempts to get a perfectly accurate area by averaging an under-estimate and an over-estimate are better than either estimate by itself, but not guaranteed to be perfect.
The only sure way to improve accuracy is to use more rectangles.
To get perfect accuracy you’d need an infinite number of rectangles, which you can’t literally do.
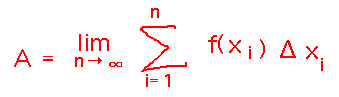
But you can tell what it would produce if you could do it by looking at the limit of sums of areas as the number of rectangles goes to infinity. This is the key idea we’ll be looking at in Section 5.1, written formally as
Summations
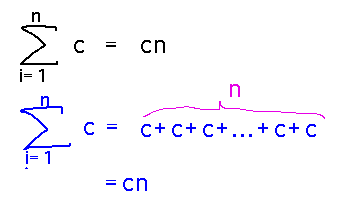
Properties. Prove property 1 from the textbook (that the sum from 1 to n of a constant c is equal to nc).
Reading ideas: Sigma notation means adding up a number of values, often but not always depending on the index variable i.
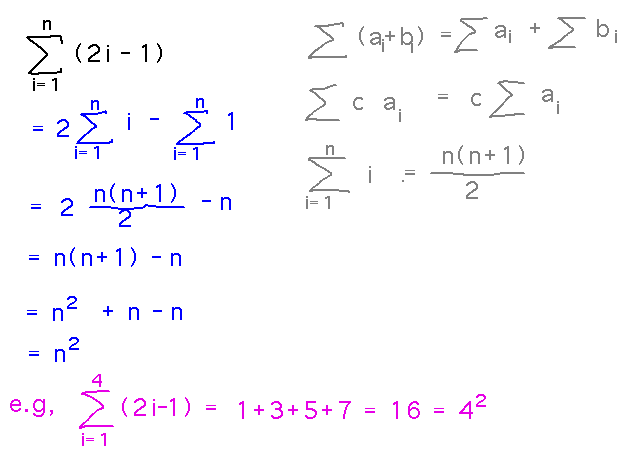
Example. Find the sum from i = 1 to n of 2i - 1.
Reading ideas: Some useful summation laws include
- The sum of a + b equals the sum of a plus the sum of b.
- The sum of a constant times ai equals the constant times the sum of ai.
- The sum of the first n positive integers equals n(n+1)/2.
Use these ideas to solve the problem:
Approximate Area
Example. Use a left-endpoint approximation with n = 6 to estimate the area between y = x2 + 2 and the x axis, between x = 4 and x = 7. Use a calculator or spreadsheet to do the arithmetic.
Reading ideas: “Left-endpoint approximation” means using the x value at the left edge of each rectangle to calculate the rectangle’s height.
So the problem (without all the rectangles) looks something like this:
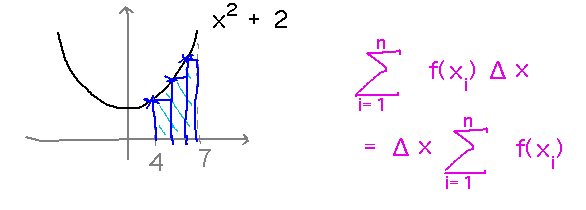
This spreadsheet calculates the area of all the rectangles, adds them up, and multiplies by the width of the rectangles (which is the same for all rectangles in this problem). Note that we numbered x values differently here than the book does: it was most natural for us to have x1 be the left-most x value and xn the left side of the last rectangle, but the book starts at x0 in order to have xn be the last x value (the right side of the last rectangle), a value you need if you want to work with right-endpoint approximations.
Next
(For Friday.)
Definite integrals as Riemann sums.
Read Section 5.2 in the textbook.