Misc
Exam 2
It will be Thursday, November 2, in class.
It will cover material not tested since the first exam (e.g., related rates, extreme values, linearization, but also the chain rule, implicit differentiation, etc.)
The rules and format will otherwise be similar to the first exam, especially the style of question and the open-references rule.
Questions?
Shapes of Graphs
Section 4.5
Overall Shape
Example. For some function f(x), f′(x) = x - 3. Is f(x) increasing, decreasing, or something else between x = 10 and x = 20?
Reading ideas:
- The 1st derivative test finds locations of extremes
- A little more generally, a positive first derivative means the function is increasing, negative means the function is decreasing.
f′ is positive on the whole interval, so f is increasing there.
More generally, where is f(x) increasing, where is it decreasing, and where does it reach its maximum/minimum?
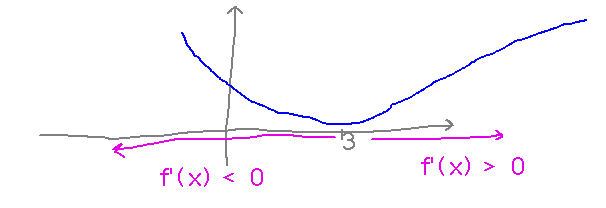
- There are critical points where f′(x) = 0, i.e., where x - 3 = 0, or x = 3.
- f′(x) < 0 if x < 3, so f(x) is decreasing there.
- f′(x) > 0 if x > 3, so f(x) is increasing there.
- By the 1st derivative test, f(3) is a minimum (because f decreases until x = 3, then starts increasing).

Example. Find the intervals over which y = x3 + 3x2/2 is increasing, the intervals over which it’s decreasing, and its critical points; determine whether critical points correspond to maximums, minimums, or neither.

Concavity
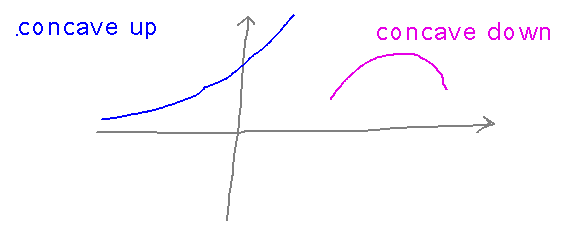
What Is It? Sketch graphs that are concave up and concave down

Example. Find the interval(s) over which y = x3 + 3x2/2 is concave up, the interval(s) over which it’s concave down, and any inflection points.
Reading ideas: A graph is concave up where its second derivative is greater than 0, concave down where it’s less than 0, and may have an inflection point where the second derivative equals 0.
See the picture above for concavity of x3 + 3x2/2.
Next
How functions behave as x goes to ± infinity.
Read section 4.6
Except not the “Determining End Behavior for Transcendental Functions” subsection.