Detector Data
NOTE: The detectors were removed from Letchworth State Park on September 30, 2020
As of September 30, 2020
| Detector | Muons Detected | Run Time | Rate (counts/sec) |
| 1 | 3,368,686 | 71 days, 3 hours, 28 minutes and 51 seconds | 0.548027272 |
| 2 | 1,664,223 | 78 days, 15 hours, 22 minutes and 23 seconds | 0.244935232 |
| 3 | 2,347,110 | 67 days, 7 hours, 11 minutes and 44 seconds | 0.403650795 |
| 4 | 1,861,157 | 68 days, 6 hours, 23 minutes and 49 seconds | 0.315545072 |
| 5 | 1,617,497 | 70 days, 10 hours, 23 minutes and 32 seconds | 0.265799084 |
| 6 | 2,712,624 | 71 days, 20 hours, 4 minutes and 33 seconds | 0.437049635 |
| 7 | 1,893,442 | 78 days, 20 hours, 23 minutes and 9 seconds | 0.277932809 |
| 8 | 1,891,604 | 56 days, 5 hours, 48 minutes and 42 seconds | 0.389273223 |
| 9 | 1,812,103 | 74 days, 17 hours, 11 minutes and 44 seconds | 0.280706644 |
| 10 | 2,707,419 | 67 days, 9 hours, 9 minutes and 25 seconds | 0.465051214 |
As of September 15, 2020
| Detector | Muons Detected | Run Time | Rate (counts/sec) | |
| 1 | 2,738,361 | 57 days, 10 hours, 15 minutes and 9 seconds | 0.551898756 | |
| 2 | 1,355,146 | 64 days, 7 hours, 41 minutes and 9 seconds | 0.243851076 | |
| 3 | 2,249,817 | 64 days, 4 hours, 25 minutes and 38 seconds | 0.405698634 | |
| 4 | 1,606,829 | 58 days, 21 hours, 10 minutes and 46 seconds | 0.315842003 | |
| 5 | 1,298,067 | 55 days, 19 hours, 29 minutes and 34 seconds | 0.269187096 | |
| 6 | 2,194,535 | 57 days, 5 hours, 24 minutes and 1 seconds | 0.443856797 | |
| 7 | 1,561,519 | 64 days, 4 hours, 48 minutes and 39 seconds | 0.28151104 | |
| 8 | 1,516,562 | 42 days, 4 hours, 57 minutes and 51 seconds | 0.415875782 | |
| 9 | 1,470,574 | 60 days, 1 hours, 55 minutes and 32 seconds | 0.283296734 | |
| 10 | 2,095,390 | 52 days, 17 hours, 28 minutes and 40 seconds | 0.45994705 |
As of August 11, 2020
| Detector | Muons Detected | Run Time | Rate (counts/sec) |
| 1 | 1,042,941 | 22 days, 8 hours, 59 minutes and 39 seconds | 0.53949524 |
| 2 | 575,296 | 29 days, 5 hours, 34 minutes and 38 seconds | 0.227778817 |
| 3 | 1,028,169 | 29 days, 3 hours, 51 minutes and 12 seconds | 0.40808914 |
| 4 | 826,104 | 29 days, 4 hours, 50 minutes and 14 seconds | 0.327427382 |
| 5 | 690,308 | 28 days, 22 hours, 23 minutes and 59 seconds | 0.276140996 |
| 6 | 1,136,597 | 29 days, 2 hours, 46 minutes and 51 seconds | 0.451817556 |
| 7 | 726,024 | 29 days, 4 hours, 16 minutes and 5 seconds | 0.287994499 |
| 8 | 702,569 | 21 days, 4 hours, 18 minutes and 16 seconds | 0.383939273 |
| 9 | 724,287 | 29 days, 3 hours, 36 minutes and 0 seconds | 0.287579826 |
| 10 | 694,280 | 18 days, 0 hours, 11 minutes and 1 seconds | 0.446235157 |
As of August 5, 2020
| Detector | Muons Detected | Run Time | Rate (counts/sec) |
| 1 | 1,040,905 | 16 days, 2 hours, 6 minutes and 10 seconds | 0.527439318 |
| 2 | 531,687 | 22 days, 22 hours, 29 minutes and 39 seconds | 0.225901594 |
| 3 | 1,052,417 | 22 days, 21 hours, 3 minutes and 12 seconds | 0.40929752 |
| 4 | 841,904 | 22 days, 21 hours, 50 minutes and 46 seconds | 0.332038372 |
| 5 | 686,752 | 22 days, 17 hours, 24 minutes and 29 seconds | 0.275572474 |
| 6 | 1,161,161 | 22 days, 20 hours, 9 minutes and 34 seconds | 0.452573511 |
| 7 | 765,519 | 22 days, 21 hours, 21 minutes and 52 seconds | 0.291231974 |
| 8 | 737,531 | 14 days, 21 hours, 47 minutes and 36 seconds | 0.394106164 |
| 9 | 756,730 | 22 days, 20 hours, 52 minutes and 46 seconds | 0.288309671 |
| 10 | 928,403 | 15 days, 3 hours, 51 minutes and 2 seconds | 0.427817499 |
Notes: When the detector temperature in the enclosure exceeds 100 deg F, the detector powers down, and has to be restarted manually. This is why the run times are different for different detectors.
The efficiency of the detectors varies, and no detector detects 100% of the muons passing through it. This is the most likely reason for why the count rates are different for different detectors.
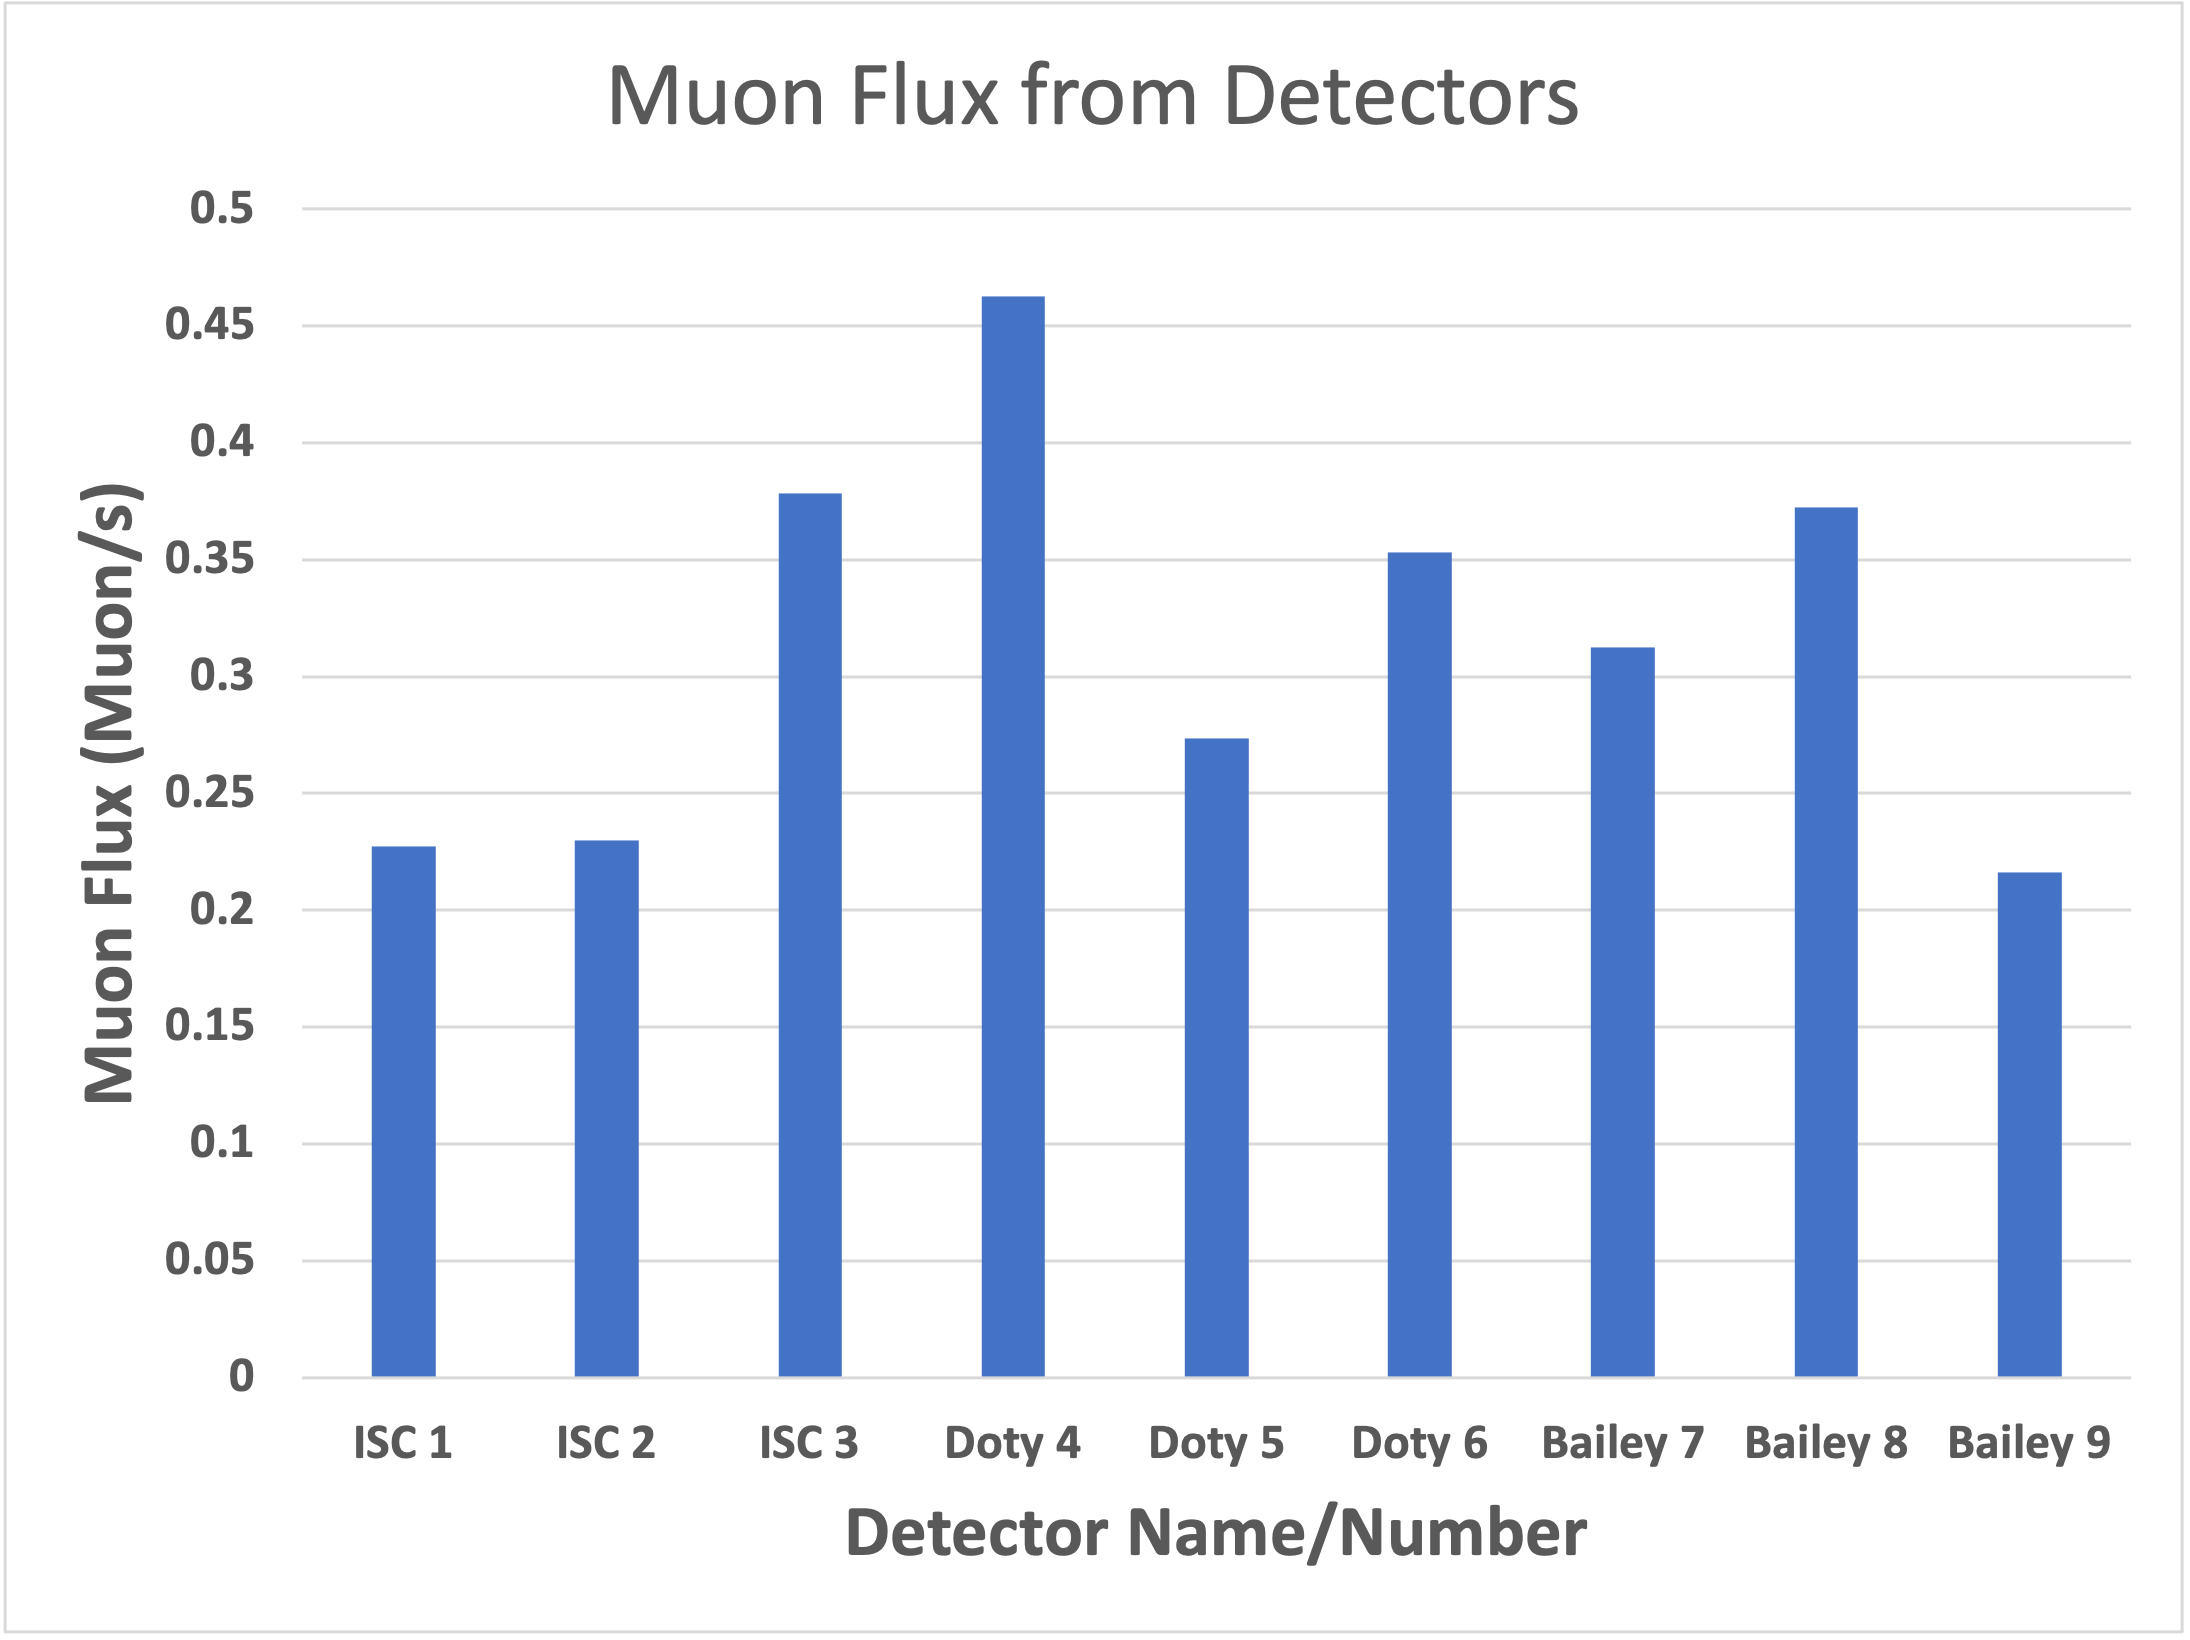
2023 -Fall Semester – Nine Cosmic Watch Muon Detectors were deployed on the SUNY Geneseo Campus as part of a Phys 372 project by Johnathan Conway. The following graph shows the Average Muon Flux for each detector, collected from Nov 7 to 14, 2023.
The efficiency of the detectors varies, and no detector detects 100% of the muons passing through it. This is the most likely reason for why the count rates are different for different detectors.
Here is a list of where the detectors were deployed:
| ISC 01 | ISC Lobby, Bottom Staircase |
| ISC 02 | ISC Lobby, Middle Staircase |
| ISC 03 | ISC Lobby Pendulum Gate |
| Doty 04 | Doty Lobby, Near Coffee Machine |
| Doty 05 | Doty Lobby, Behind Coffee Machine |
| Doty 06 | Doty Lobby, North Railing |
| Bailey 07 | Bailey Lobby, North Post |
| Bailey 08 | Bailey Lobby, Middle Post |
| Bailey 09 | Bailey Lobby, South Staircase |