Graphs
This section contains relevant graphs of data that we have collected on Tricol-md-3D. These graphs include timings of initialization and redisplay while executing this program on different operating systems such as Windows and Solaris. Initialization time is the time it takes for Tricol-md-3D to initialize all variables and read the file before it can display the first image. Redisplay time is the time it takes for Tricol-md-3D to redraw the particles at a different rotation or position.
Please click on the picture to see the graph.
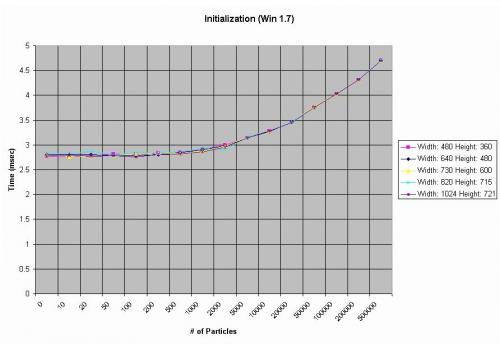
This graph shows the logs of the initialization times for different sizes of particle files under various different operating systems. This graph shows the logs of the redisplay times for different sizes of particle files under various different operating systems.