Institutional Research & Effectiveness Dashboards
IRE Menu of Dashboards
All IRE dashboards are now available through a single categorized and searchable menu of dashboards: IRE Menu of Dashboards)
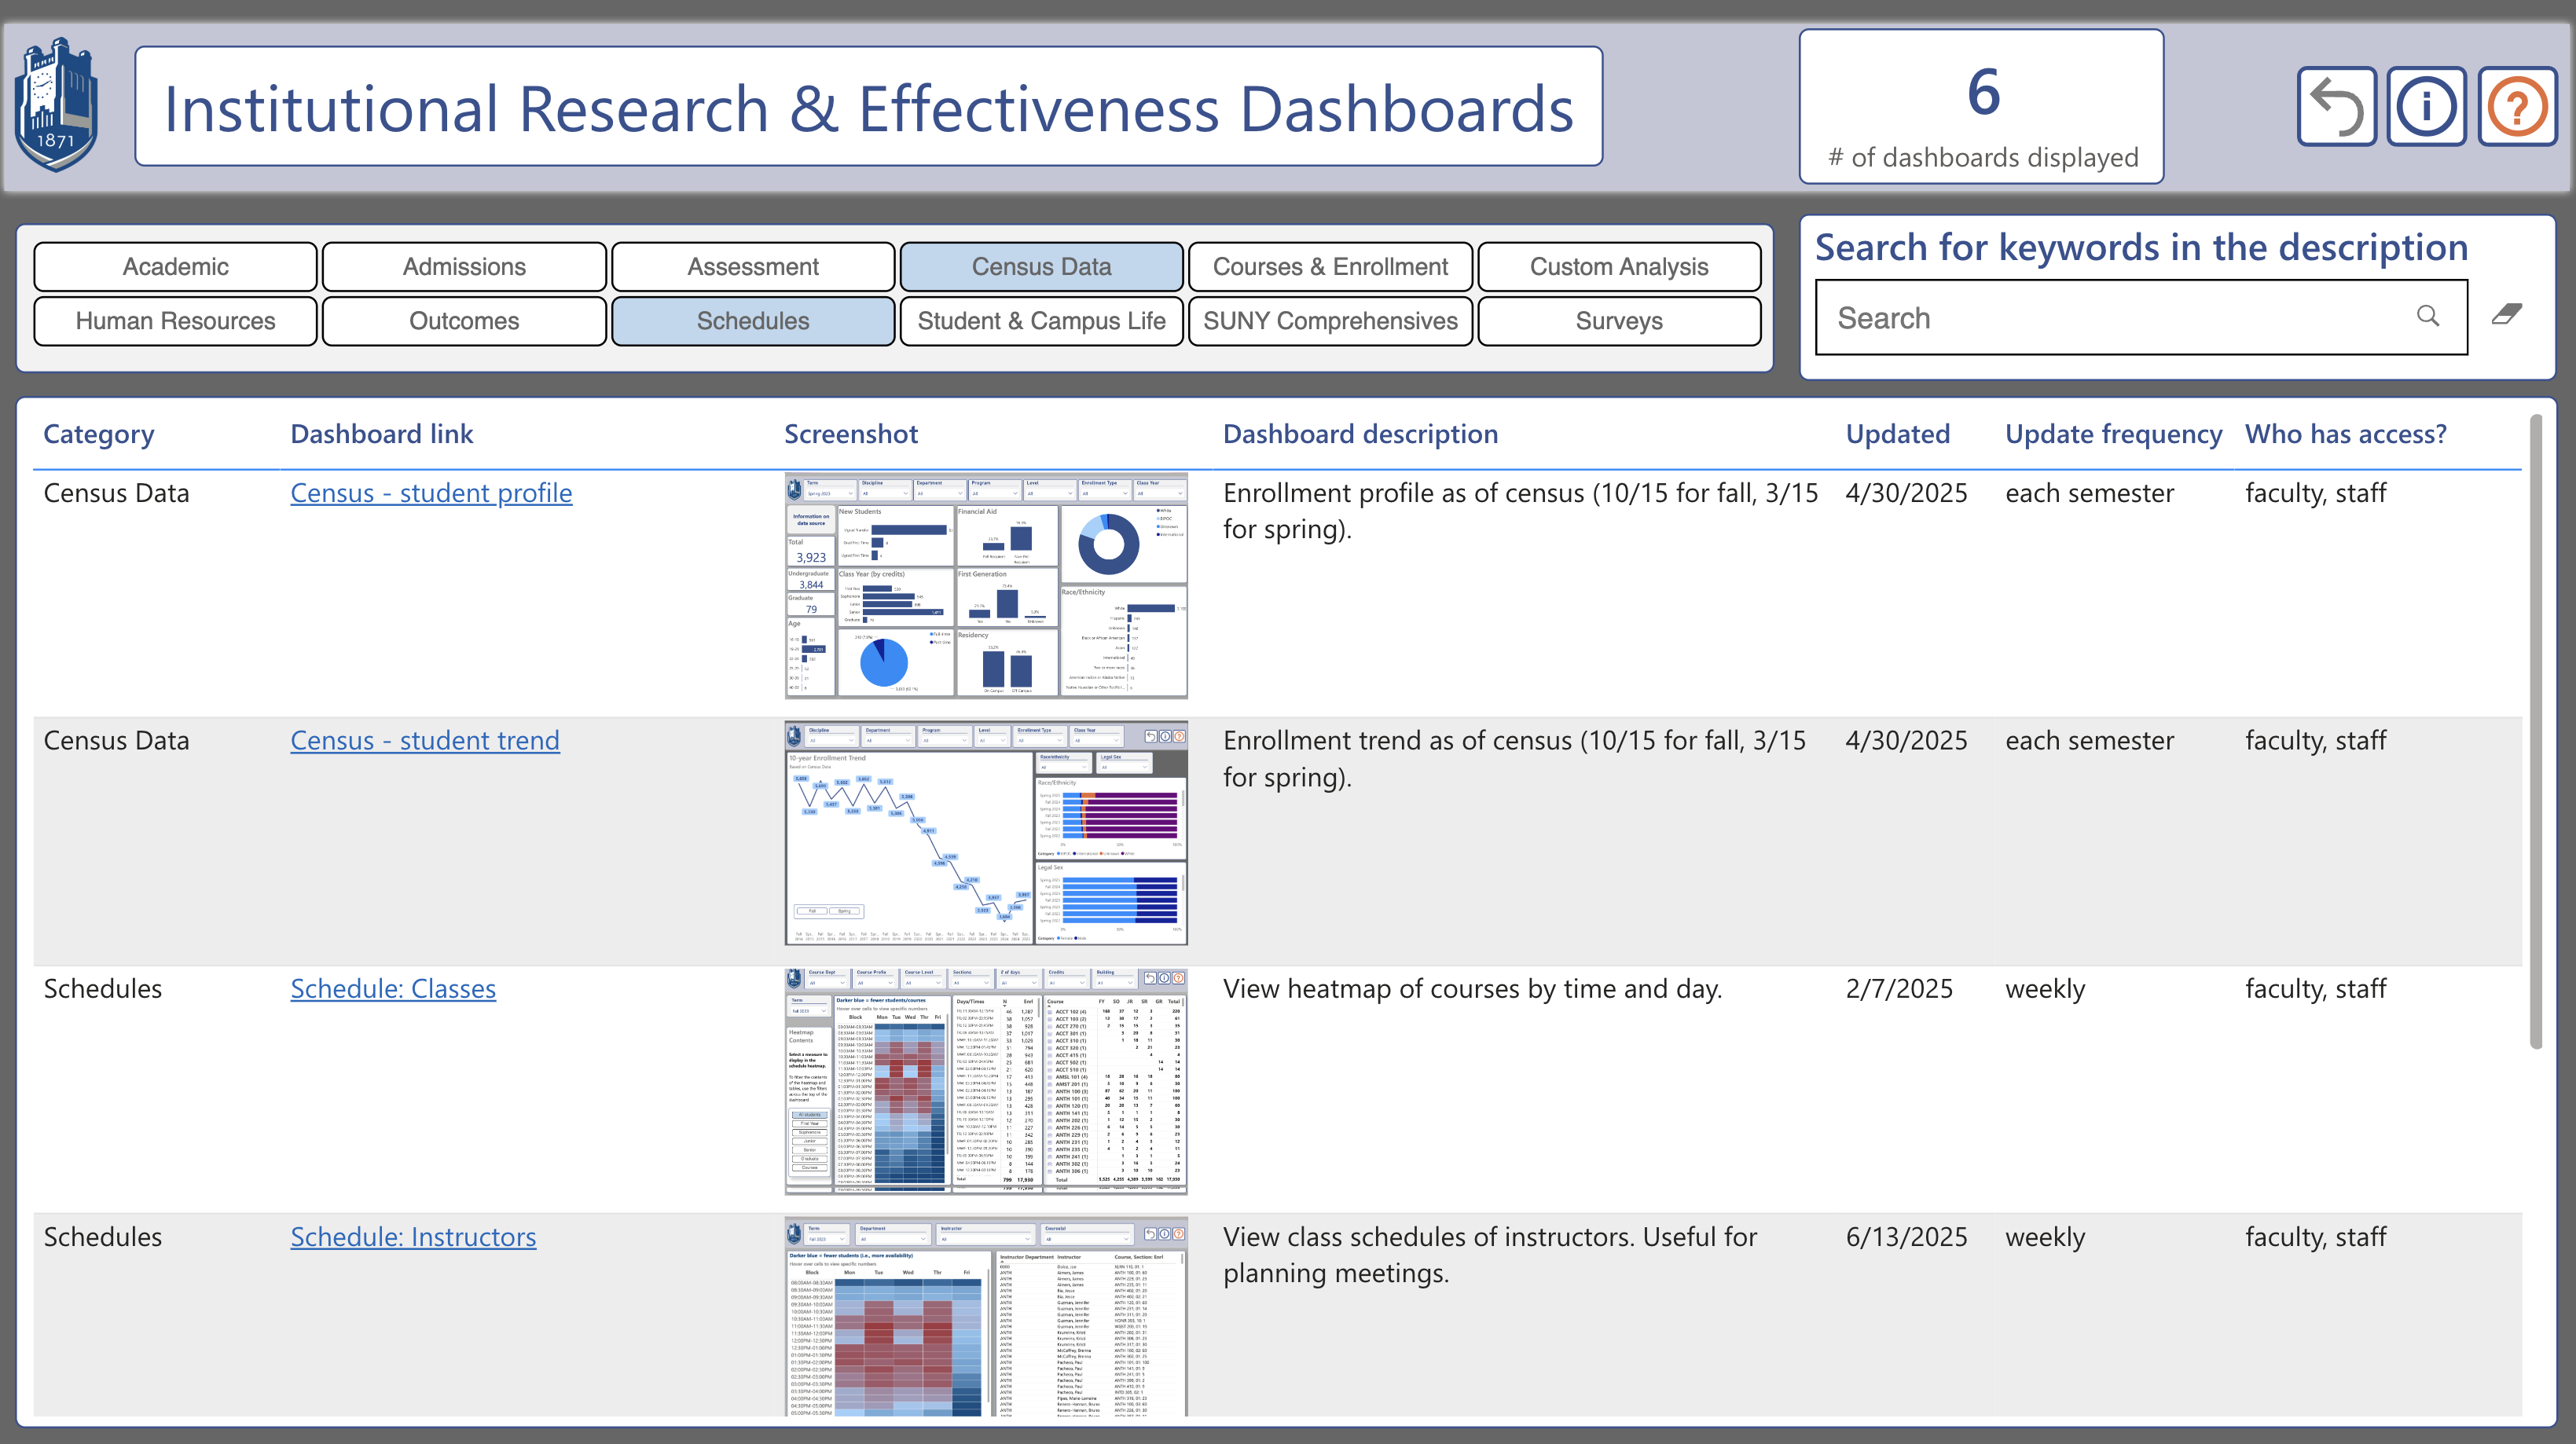
All IRE dashboards are now available through a single categorized and searchable menu of dashboards: IRE Menu of Dashboards)